
Healthcare facility leaders closed the healthcare costs 2026 budget cycle with the worst input-cost-versus-reimbursement gap in years. Total operating expense growth ran 7.5% year-over-year against CMS net statutory updates in the low twos. The procurement playbook was not built to close a gap that wide, and most of the lines absorbing the squeeze were not lines the playbook was ever going to renegotiate.
The categories absorbing the largest increases this year share a single feature: cutting any one of them would put the facility out of compliance with the regulations that license the facility to operate. The compliance stack pinning those costs in place is what the procurement playbook has been trying to renegotiate around. Recruitment is the one line the stack does not pin. Converting contingent travel nurses to permanent staff removes the agency margin layer and the GSA-channeled compensation structure the contract was built on, leaving a permanent wage line the facility owns. That is what the 2026 budget cycle leaves the facility able to do.
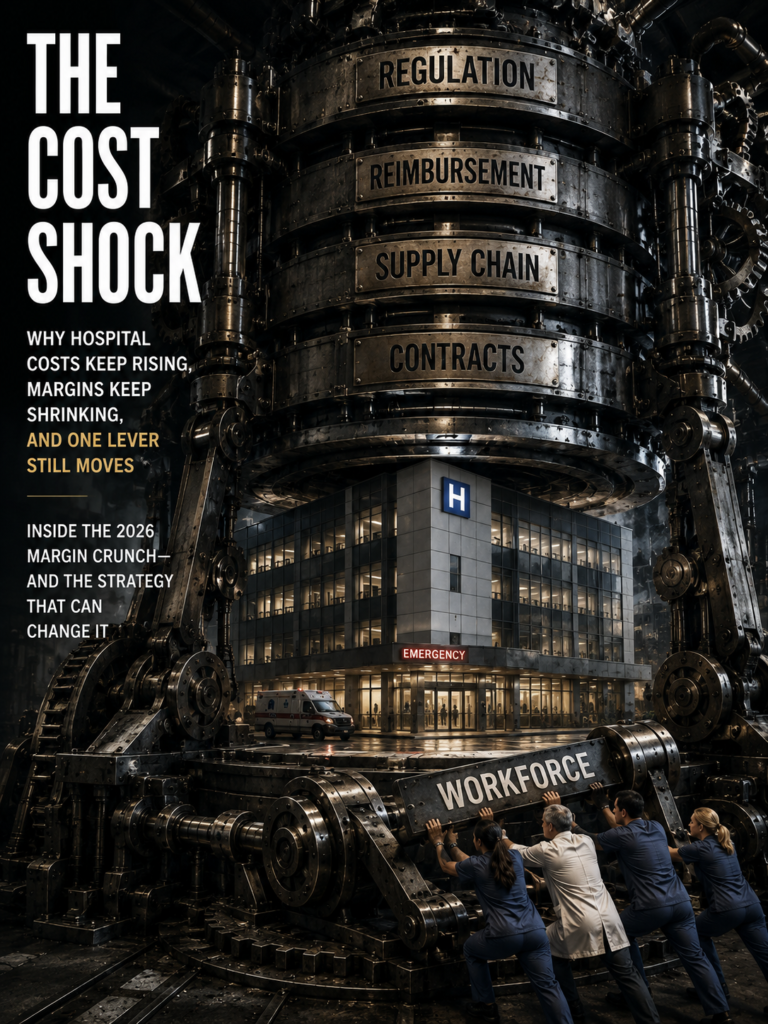
Where the Compliance Stack Pins Healthcare Costs
The first front of the 2026 cost shock sits on the facility side of the P&L. Energy efficiency retrofits and on-site generation do not loosen it. Utility spend, purchased services, and overhead together hold the highest non-labor inflation rate in the AHA’s 2026 Costs of Caring ranking. The compliance requirements holding those costs in place, and the contractual escalation clauses locking in further increases, are what the budget cannot exit.
Utility costs cannot fall below clinical minimums
The utility line is pinned by a stack of overlapping compliance mandates that each pull a separate load continuously. The mandate stack includes ASHRAE Standard 170, AAMI ST79 sterile processing, and manufacturer cryogenic specifications for MRI helium compressors. ASHRAE 170 alone requires 6 to 12 air changes per hour in acute care and 20 air changes per hour in operating suites. AAMI ST79 governs steam autoclave cycles for sterile processing departments. MRI cryogenic specs require continuous power to the helium compressor and cooling loop to prevent magnet quenches. Each mandate runs on a schedule the patient census cannot alter.
The mandate stack produces a regional spread the procurement office cannot arbitrage. The 2026 commercial electricity national average sits at 17.14 cents per kilowatt-hour. New York runs at 29.93 cents per kilowatt-hour, +12.1% year-over-year, with the highest regional pressure tied to the same transmission pipeline the facility draws from. The regional spread confirms the kilowatt and the cubic foot of steam run on the regional pipeline rather than on the facility’s negotiated contract. The rate band was set by the pipeline long before the facility drew its first amp, and the line was never the facility’s line to renegotiate.
Purchased services grew faster than labor did
Purchased services and overhead represent 15.0% of operating budget in 2026. The line grew at 13.0% year-over-year. Labor’s growth ran at 5.6% year-over-year. The differential means the smaller line moved at more than double the rate of the larger line.
The 15% bucket covers environmental services, dietary, security, laundry, and outsourced revenue-cycle management. These are vendor categories where commercial contracts run on multi-year terms with cancellation penalties that exceed any savings a renegotiation would deliver. The cancellation math absorbs the savings math on every contract the procurement playbook would normally call renegotiable, and the budget absorbs both because the buy-out exceeds the savings. The remaining vendor categories (biomedical maintenance, IT services, cybersecurity) sit on a different regulatory anchor, which the next section names. The same no-exit logic that applies to the utility line applies to a cost category several multiples larger.
The 13.0% inflation rate includes the $43 billion annual administrative cost of collecting payments from commercial insurers, a figure the AHA published. That figure sits outside what the facility can renegotiate. The friction lives on the payer side, not the facility side. The facility cannot use procurement tactics against a payer-side friction to reduce unit cost. The same regulatory anchor applies to a cost line several multiples larger than the utility line. The procurement office’s failure on the larger line is the same constraint problem, this time anchored to a survey cycle the facility cannot exit.
Licensing pins the rest of the facility line
The rest of the facility-side cost front is held by operational licensing requirements. Those requirements run from state inpatient licensure through Joint Commission accreditation through CMS Promoting Interoperability through HIPAA Security Rule and the 2025 CMS Cybersecurity Performance Goals. Each anchor pins a vendor contract the facility cannot terminate without violating a license to operate. Survey findings, accreditation actions, and CMS conditions-of-participation are the failure modes that produce consequences beyond unit-cost increases. The dollar amount that disappears from the operational line is the dollar amount that disappears from a survey finding.
Three vendor contracts anchor the licensing floor. Biomedical maintenance contracts tie to Joint Commission accreditation and sterilization-monitoring cycles the surveyor names directly. IT services contracts tie to CMS Promoting Interoperability, the same CMS architecture that drives facility-side staffing floors, and the 99.999% EHR uptime requirement that architecture imposes. Cybersecurity infrastructure ties to HIPAA Security Rule and the 2025 CMS Cybersecurity Performance Goals the rule names as a category requirement.
The first set of constraints is not a market problem. It is a license-to-operate and outsourced-services problem the procurement playbook cannot touch inside a budget cycle. The same compliance pattern will repeat on the labor side. A different federal tax-and-per-diem framework sits beneath the contingent staffing bill. That framework is one the hospital did not author, and it does not ask for the hospital’s opinion.
Where the Wage Bill Bends to Federal Code
The cost shock’s second front is the contingent labor line. The dollar magnitude that absorbs the cap and clock lift is the largest line on the operating budget. Travel nurses are paid a premium because the work is hard and the catchment is hard to fill. The dollar that lands on the hospital’s variable expense line, however, does not reflect what the clinician takes home. It reflects what a federal tax code and a federal per diem schedule structure, with the hospital paying the full bill and gaining none of the FICA savings on the tax-free portion. The clinician is the courier. The hospital is the address. The federal tax-and-per-diem framework is what structures the package.
Per-diem caps and the IRS clock lift the wage bill
Two federal mechanisms operate on the contingent clinician compensation package. The General Services Administration per diem schedule caps tax-free housing and meals allowances without forfeiting tax-home status. The Internal Revenue Code §162(a)(2) framework, with IRS Publication 463, allows the housing and meals portion to be paid tax-free only when the clinician maintains a permanent tax home and a single-assignment duration not exceeding 12 months. The cap and the clock operate as a single federal framework.
The 2026 GSA Continental United States per diem is $178 per day, broken into a $110 lodging allowance and a $68 meals-and-incidental-expense allowance, as the GSA per diem framework structures. Non-Standard Areas scale the cap sharply. New York City peak autumn reaches a daily total of $393 to $434 for lodging and M&IE combined. The cap is a federal schedule the hospital does not negotiate, and the cap scales with the same regional geography the electricity rate and the purchased services rate already mapped.
The clock is the other half of the same federal framework. It operates on the rotation cycle the next H3 names.
The 12-month rule forces nurse rotation
The IRS 12-month rule is the timing constraint that prevents travel nurses from settling permanently in high-cost catchment areas. A temporary assignment in a single geographic location cannot exceed 12 consecutive months. Beyond 12 months, the IRS reclassifies the lodging and meals stipends as fully taxable wage income. The reclassification removes the agency’s ability to structure the bill within the GSA cap without losing the tax advantage to the clinician.
The rule forces clinicians to rotate out of host health systems every 13 to 52 weeks. The wage ratio that makes the rotation economically painful is the 2026 travel rate of $75 to $85 per hour against an employed staff RN baseline of $39 per hour. That ratio is still nearly double the employed cost, even after the post-pandemic correction from the 2022 pandemic peak of $132 per hour. The rotation triggers a fresh channeling through the per diem structure of the new locale.
Agency bill-back lands labor on the expense line
The 2026 average agency travel nurse bill rate of $95.00 per hour decomposes into five channels, the same compensation framework Beyond Bill Rates walks in detail. The taxable base wage component is $32.00 per hour, or 33.7% of the bill. The tax-free housing stipend is $30.00 per hour, or 31.6%. The tax-free M&IE allowance is $12.00 per hour, or 12.6%. Employer payroll taxes run $5.00 per hour, or 5.3%. Agency gross margin runs $16.00 per hour, or 16.8%. The hospital pays the full $95.00 hourly bill rate invoiced directly to hospital operating expense. The five channels sum to a federal-channeled compensation package the hospital cannot restructure.
The FICA consequence of the structure is significant. By maximizing non-taxable stipends within legal GSA limits and keeping base taxable wages low, staffing agencies reduce their mandatory employer FICA tax liability. The reduction runs 7.65% on every dollar shifted from taxable wages to tax-free stipends. The FICA savings belong to the agency. The hospital records the entire expense as purchased contract labor under variable operating expenses. The hospital captures none of the FICA advantage.
The rotation cycle the 12-month rule forces compounds the same problem. Each rotation re-triggers a $60,090 RN replacement cost the facility pays on the turnover line, the same cost cycle that compounds across each rotation, and the underlying turnover mechanic is what the facility absorbs each cycle. Bedside RN turnover runs at 17.6%. The bill rate is not a wage. It is a federal-channeled compensation package with an agency margin layer on top. The package lands on the variable expense line. The cost lever the federal framework still allows the facility to move sits on the housing line.
Housing, not wages, is where the cost lever sits
The variable to move is housing, not wages. When local rental housing costs rise faster than permanent staff wage updates, the channel converts housing pressure into a turnover cascade. Escalating residential rents reduce discretionary income for permanent nursing staff. The reduced discretionary income prompts resignations and transitions into contingent travel roles. Hospital RN vacancy rates increase. Average recruitment durations extend to 85 to 110 days per open position. The housing line is the budget-cycle line item with variables still to move.
Facilities that have identified the correct variable have begun to shift capital from clinical expansion projects into building and subsidizing real estate for their clinical workforce. The supply-side dynamics are why the labor line is structural, but the housing diagnosis is the variable inside that structure. Beaufort Memorial Hospital broke ground on LiveWell Terrace in Bluffton, South Carolina, in June 2026. LiveWell Terrace is a 120-unit affordable and workforce housing community developed in partnership with Woda Cooper Companies and the Town of Bluffton. Rents target $690 to $1,725 per month. Concurrently, Beaufort Memorial invested an additional $1.3 million into Canal Street Apartments. The investment acquires priority leasing rights for 14 one-bedroom units. Facility capital deployment proves the diagnosis: the variable to move is housing, not wages.
The diagnosis extends to rural geographies. Fall River Health Services, a 25-bed critical access medical center in Hot Springs, South Dakota, committed $2.3 million from cash reserves toward a $3.4 million Cascade Hills housing subdivision infrastructure project facilitating 48 workforce housing units in response to a 10% staff vacancy rate. The annual gap between travel cost and permanent cost anchors the conversion economics, and the housing variable is a budget-cycle line item rather than a strategic abstraction. The same compliance pattern repeats on the supplier side, where a different cost bucket sits under a different regulatory constraint.
Why the Supply Chain Refuses to Substitute
The cost shock’s third front is the non-labor supply chain, where the procurement office has control over commodity med-surg lines but that control does not reach the high-cost specialty lines that make up the supplier bucket. The same compliance pattern the prior two H2s established repeats here at a different funding layer: the constraint type is validation requirements, contract structures, and channel restrictions rather than a tax-code framework, and the lines the procurement office cannot reach are the categories that drove the supplier-bucket inflation.
Med-surg and pharma drive the supplier bucket
Medical-surgical supplies at 18% of budget carry +9.9% year-over-year inflation. Pharmaceuticals at 9% of budget carry +13.6% inflation. Together they exceed labor’s growth rate on a line item roughly half the size of the labor line. The compliance-driven magnitude is there.
The pharmaceutical inflation concentrates where the cost is highest. Specialty pharmaceuticals represent 12 to 15% of pharmacy spend at academic medical centers and 5 to 7% at critical access hospitals. Oncology and autoimmune biologics together represent nearly half of total pharmacy spend, with projected annual price increases in the 4% range. The concentration explains why the supplier bucket inflates faster than the medical-surgical line at half its dollar size. Specialty therapeutics carry the highest inflation rate because the dispensing channel cannot be substituted.
Vizient’s Summer 2026 Spend Management Outlook projects specialty and biologic drugs at +4.04% inflation. IT security projects at +8.50% inflation. The GPO market remains concentrated among Vizient, Premier, and HealthTrust. The concentration delivers 10 to 18% cost reductions on commodity medical-surgical products and mature generics. The capacity narrows on the high-cost specialty lines that drive the inflation. The supplier bucket’s magnitude is what the regulatory constraints the next two H3s name are applied to.
Deflation still works where hospitals overpaid
Documented deflationary categories in 2026 do exist. The pattern they reveal is that competitive supply pressure pushed prices back down only in the categories hospitals were already over-paying for. The four named deflators are Humira biosimilars at -7.6% following expanded biosimilar market adoption. Lab equipment sits at -0.36%. Neurological physician preference items sit at -1.27%. Propane forecasts at -14.7% to -17.3% against the 2025 forecast. The deflators point at categories where competitive supply pressure could push prices back down.
The Vizient non-pharmacy sub-index shows the lab equipment and neurological implant deflators are vendor-competition deflators. Two or more suppliers competed for the same contract in each case. The propane deflator is a commodity-input deflator that lowered thermal heating expenses for rural facilities using off-grid propane systems. WTI crude softened to $68 per barrel. The commodity side of the inflation map moved in the opposite direction from the labor side. The same constraint pattern ties deflators and inflators together.
The deflators and the supplier-bucket inflators sit on the same pattern: competitive supply pressure closes the gap when supply is competitive. The categories where hospitals were already losing money on inflated contract labor markups and outsourced vendor markups were the categories where competitive pressure could push prices back down. The high-cost specialty lines that make up the supplier bucket are the categories where supply is not competitive. The procurement lever does not reach.
The supplier bucket is pinned above substitution
Three interlocking constraints pin the supplier bucket above substitution. Group Purchasing Organization concentration with manufacturer bypass for high-cost biologics is the first constraint. FDA-validated cold chain integrity for advanced therapeutics is the second constraint. 340B contract pharmacy restrictions that lock the dispensing channel is the third constraint. Each constraint applies to a different line in the supplier-bucket categories that the prior H3 could not reach with competitive pressure.
GPO concentration operates within that range. High-cost biologics operate outside it. CAR-T cell therapies such as Carvykti and Yescarta, plus single-source specialty injectables, are sold direct-to-provider by the manufacturer, bypassing the GPO discounting structure entirely. FDA-validated cold chain integrity for advanced therapeutics requires validated temperature ranges, and any breach invalidates the dose and the cost.
340B contract pharmacy restrictions lock the dispensing channel for safety-net hospitals. The third set of constraints is a validation, uptime, and contract-structure problem. The supplier bucket is pinned above substitution because the three constraints operate on federal and accreditation rules the procurement team does not have standing to challenge. The cost line the procurement team can still move sits on a different regulatory layer, and substitution was never what the rules intended for the procurement team to reach.
Where the Margin Recovers
Three sets of regulatory constraints hold. The recruitment line is the only cost line the framework still allows the facility to move.
One line remains variable when floors hold
CMS Fiscal Year 2026 net payment updates sit at 2.6% for inpatient prospective payment systems and 2.7% for long-term care hospitals, per the CMS IPPS FY 2026 Final Rule. Outpatient prospective payment systems sit at 2.6%. Total operating expense growth runs at 7.5% year-over-year. The shortfall reaches negative 4.9 percentage-points per patient encounter. The gap is what the recruitment line has to close.
Approximately 60 to 70% of health system revenue is governed by multi-year payer contracts that typically run two to three years in duration. Built-in escalator clauses average 2.5 to 3.5% annually. The hospital absorbs the input cost surge under fixed contracts for 18 to 36 months before commercial fee schedules can be renegotiated. CMS annual updates lag behind the actual cost spike. MedPAC forecasts Fiscal Year 2027 IPPS operating rate increase of only 2.3%. The recruitment budget is the line most facilities still treat as flexible.
Conversion removes the gross margin layer
Converting a contingent travel nurse position to a permanent staff role removes the 16.8% agency gross margin. That margin represents $16.00 per hour on the $95.00 hourly bill rate. The conversion also removes the GSA-tax-channeled draws. Those draws run $30.00 per hour tax-free housing plus $12.00 per hour tax-free M&IE. The contingent bill rate of $95.00 per hour is replaced by a permanent compensation package of approximately $58.50 per hour on 1,872 annual hours. The permanent package is the bill rate the facility owns.
The annual savings on a single conversion reach $66,081 per FTE. The figure is the difference between the agency bill ($95.00 × 1,872 = $177,840) and the permanent compensation ($109,512 per year at the established $58.50 rate). Approximately $1.32 million per twenty-position conversion based on AHA and NSI 2026 data. Each rotation cycle the IRS 12-month rule would have triggered also adds $60,090 in RN replacement cost the facility pays on the turnover line.
The friction is the agency contractual conversion clause that demands 15 to 25% of the clinician’s first-year salary ($13,500 to $22,500) if the conversion happens within 12 months of contract initiation. The clause is the last margin layer on a bill the regulatory framework has been structured to extract.
Once converted, the recruitment line stops behaving like a flexible spend and starts behaving like a permanent wage line. The variable that was locked into the IRS- and GSA-channeled compensation package becomes a wage line the facility owns. Converting the contingent line is how the facility stops paying the markup on those categories. This is the one line still movable the broader 2026 cost thesis identifies.
What conversion does not touch
The permanent-line conversion leaves the regulatory framework intact wherever it was built to enforce. The same constraints established earlier in the article persist unchanged: the facility-side licensure and accreditation requirements, the clinician-side GSA per diem and IRS 12-month clock, and the supplier-side FDA cold chain integrity and 340B restrictions. Converting contingent labor into permanent staff removes the agency gross margin and the GSA-tax-channeled draws, while every other line persists under the same federal rules.
Conclusion
The 2026 healthcare facility cost shock is engineered into the regulatory constraints, not the result of market dysfunction. Reading those constraints for the one line they permit the facility to move is the only move the budget cycle leaves.